The next exhibit illustrates the concept of sampling variation in estimating the correlation with n=15.
Exhibit: Sampling variation of r with n=15 (Diaconis & Efron 1983 p. 122)The original sample of 15 schools is shown.
Exhibit: Scatterplot of average GPA against average LSAT score (Diaconis & Efron 1983 p. 118)The principle of the bootstrap is to select a large number of samples of size n with replacement from the original sample. The samples are called bootstrap samples. Some cases are typically represented more than once in a bootstrap sample.
Exhibit: Principle of the bootstrap (Diaconis & Efron 1983 p. 119)The standard error of estimate of the parameter (here the correlation) is derived from the observed frequency distribution of the estimates in the bootstrap samples (the bootstrap distribution).
Exhibit: Frequency distribution of r with 1,000 bootstrap samples (Diaconis & Efron 1983 p. 120)The bootstrap distribution can be shown to be a highly accurate approximation of the true sampling distribution of the estimator.
Exhibit: Comparison of bootstrap distribution of r with true distribution & with analytically derived distribution (Diaconis & Efron 1983 p. 123)
Exhibit: Bootstrapping with random X sampling (NKNW Table 10.8 & Figure 10.9 p. 433)
CI{bk} = (bk(obs) - t(1-a/2, k-1)s*{bk*}, bk(obs) + t(1-a/2, k-1)s*{bk*})where bk(obs) is the estimate of the regression coefficient from the original sample, k is the number of bootstrap samples, and t(1-a/2, k-1) is the 100(1-a/2) percentile of the Student t distribution with k-1 df. (For reasons that are not yet entirely clear to me this method is sometimes called "naive".)
(bk* (a/2), bk*(1-a/2))where bk*(p) is the 100pth percentile of the empirical bootstrap distribution. So for example the 95 percent CI is bound by the 2.5th and 97.5th percentiles of the bootstrap distribution. The percentile method requires at least 500 bootstrap samples because the method uses the tails of the bootstrap distribution.
Exhibit: Scatterplot of GPA by LSAT - original sample (n=15)
m13008.gif (alternate picture)
Exhibit: Bootstrap analysis of Spearman rank correlation of GPA with LSAT (1,000 samples)
Exhibit: Bootstrap analysis of Spearman rank correlation of GPA with LSAT- program only
Exhibit: Frequency distribution of bootstrap estimates (n=1,000)
m13011.gif (alternate picture)
Exhibit: Bootstrap analysis of the Longley data
Exhibit: Bootstrap analysis of Yule's model with OLS and robust regression (bisquare 3.5)
Exhibit: Same - program only (yuleboot.syc)
Exhibit: Bootstrap analysis of robust regression of graduation rate model
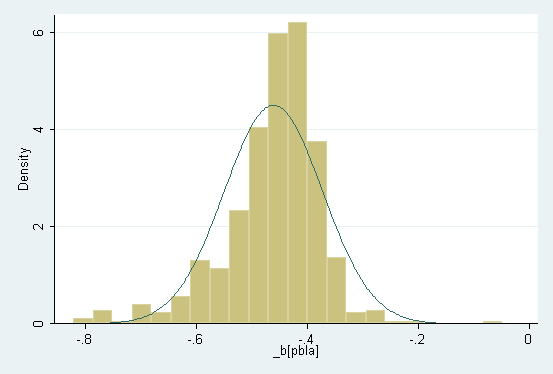
Exhibit: Bootstrap distribution of b_pbla (histogram)
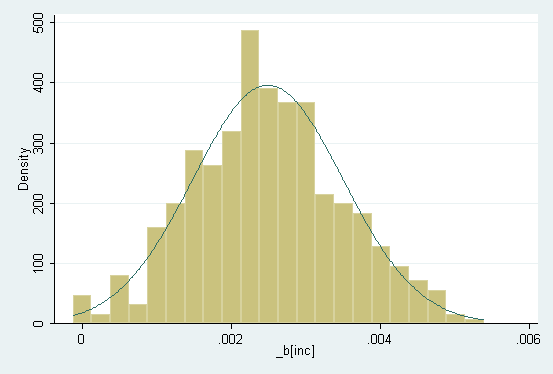
Exhibit: Bootstrap distribution of b_inc (histogram)
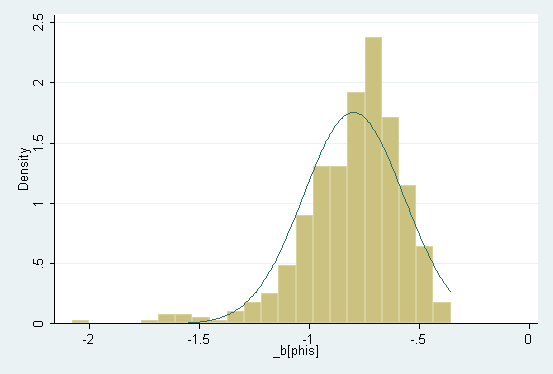
Exhibit: Bootstrap distribution of b_phis (histogram)
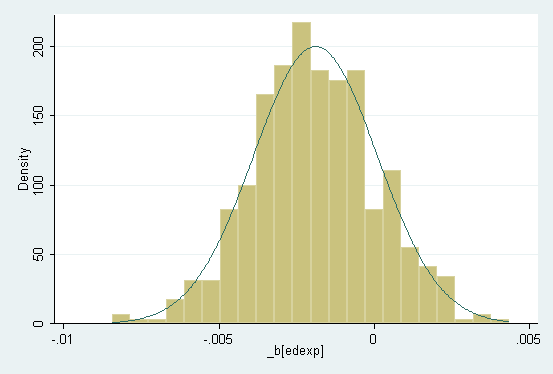
Exhibit: Bootstrap distribution of b_edexp (histogram)