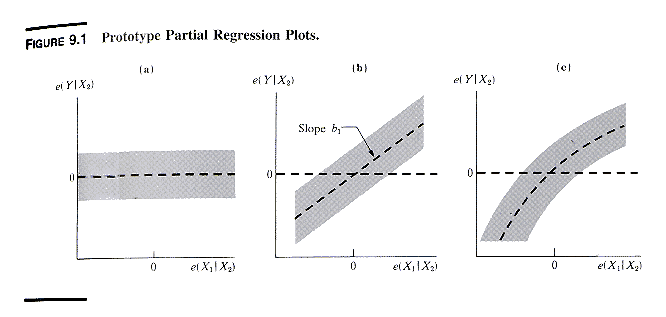
Partial regression plots are another diagnostic tool that permits evaluation of the role of individual variables within the multiple regression model. They are used to assess visually
Y = b0 + b1X1 + b2X2 + b3X3 + eThere is a regression plot for each one of the X variables.
^Yi(X2, X3) = b0 + b2Xi2 + b3Xi32. Regress X1 on X2 and X3 and a constant, and calculate the predictors and residuals
ei(Y|X2, X3) = Yi - ^Yi(X2, X3)
^Xi1(X2, X3) = b0+ + b2+Xi2 + b3+Xi33. The partial regression plot for X1 is the plot of
ei(X1|X2, X3) = Xi1 - ^Xi1(X2, X3)
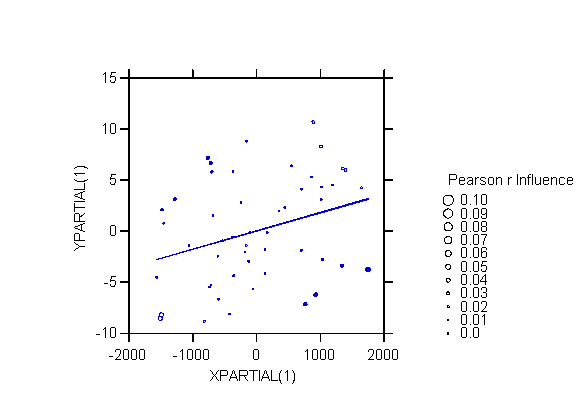
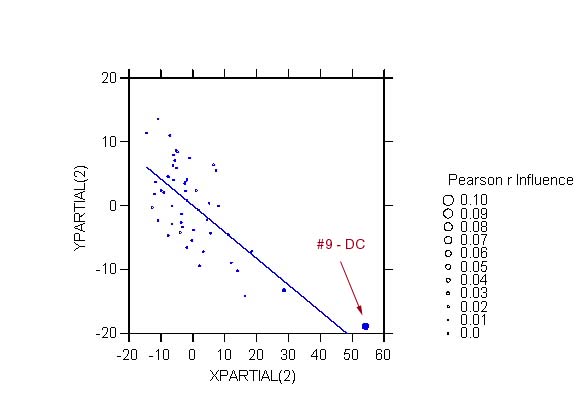
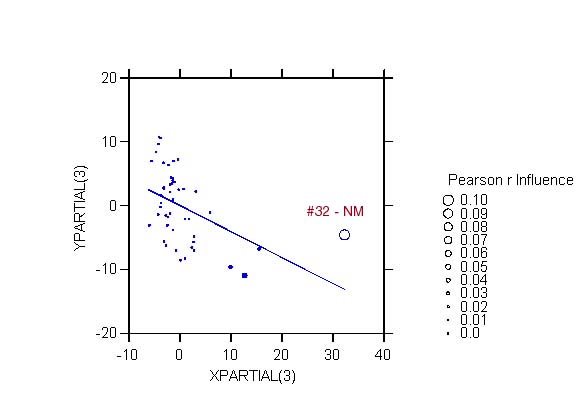
ei(Y|X2, X3) against ei(X1|X2, X3)In practice, statistical programs such as SYSTAT have options to save the partial residuals ei(Y|X2, X3) and ei(X1|X2, X3) when estimating the regression model, so one does not need to do these auxilliary regressions separately.
GRAD = CONSTANT + INC + PBLA + PHIS + EDEXP + URB.The data and the regression results are shown in the next 2 exhibits.